(no subject)
May. 17th, 2026 05:12 am Like salsa verde on your favorite burrito, a green
 Comet R3 PanSTARRS might be best remembered as an Orion comet.
| archive - contact - sexy exciting merchandise - search - about |

| ← previous | May 15th, 2026 | next |
May 15th, 2026: I ran this comic past one of my Warhammer buddies and asked "Is $5000 an appropriate number here? Should it be $1000 instead?" and he said no. He said $5000 was the most accurate number. Shout out to all my Warhammer buddies and your what I can only presume is extremely hardcore budgeting!! – Ryan | ||
 What are some of the most interesting astronomical objects you can see in the night sky?

Maps can show more than just where things are—they can also show how things change. New maps of artificial light reveal a planet that has been reshaping its nights through patterns of brightening and dimming.
The maps are based on a recent analysis of NASA’s Black Marble data, which found that instead of a gradual increase in artificial light at night over the course of nearly a decade, the patterns are much more nuanced. The analysis portrays a world flickering with industrial booms and busts, construction, and blackouts, as well as more gradual shifts, such as policy-driven retrofits.
NASA’s Black Marble product uses observations from the VIIRS (Visible Infrared Imaging Radiometer Suite) sensors on the Suomi-NPP, NOAA-20, and NOAA-21 satellites to produce records of nighttime lights at daily, monthly, and yearly time scales. The VIIRS day-night band detects nighttime light in a range of wavelengths from green to near-infrared and uses filtering techniques to observe signals such as city lights, reflected moonlight, and auroras.
The map above shows changes in brightness across most of the inhabited world (between 60 degrees south and 70 degrees north). Yellow and gold areas are where there has been more brightening during the study period, from 2014 to 2022, and purple areas are where there has been more dimming.
The visualization below shows the same data for the Eastern Hemisphere. Note that this version includes some artistic touches, such as simulated sunlight and shadows, while the nighttime lights data overlaid on the globe remain grounded in the scientific analysis. The image was featured on the cover of Nature, where the study was published in April 2026.

Overall, the researchers found that global radiance increased by 34 percent during the study period, but that surge masks large areas of dimming. Such “bidirectional changes” often happen side by side. In the U.S., for example, West Coast cities grew brighter as their populations increased, while much of the East Coast showed dimming, which the team attributed to the increased use of energy-efficient LEDs and broader economic restructuring.
The authors concluded that internationally, nighttime light surged in China and northern India along with urban development, while LEDs and energy conservation measures coincided with reduced light pollution in Paris and throughout France (a 33 percent dimming), the UK (22 percent dimming), and the Netherlands (21 percent dimming). European nights dimmed sharply in 2022 during a regional energy crisis that followed the outbreak of the Russia-Ukraine conflict.
Large versions of the maps on this page can be downloaded below. Animations showing annual changes in nighttime lights throughout the study period are available from NASA’s Scientific Visualization Studio.
NASA Earth Observatory images by Michala Garrison, using data from Li, T., et al. (2026). Story by Sally Younger adapted for Earth Observatory by Kathryn Hansen.
Stay up-to-date with the latest content from NASA as we explore the universe and discover more about our home planet.
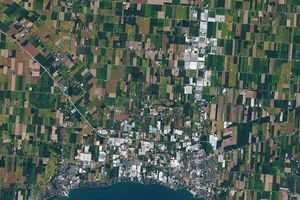
The expansion of greenhouses in southern Ontario is changing the appearance of the land surface—and the night sky.

A vivid display of the aurora lit up skies over the Denmark Strait and eastern Canada during a minor geomagnetic…

A series of nighttime satellite images revealed how moonlight reaching Earth varied throughout a total lunar eclipse.
The post Picturing Earth in a New Light appeared first on NASA Science.
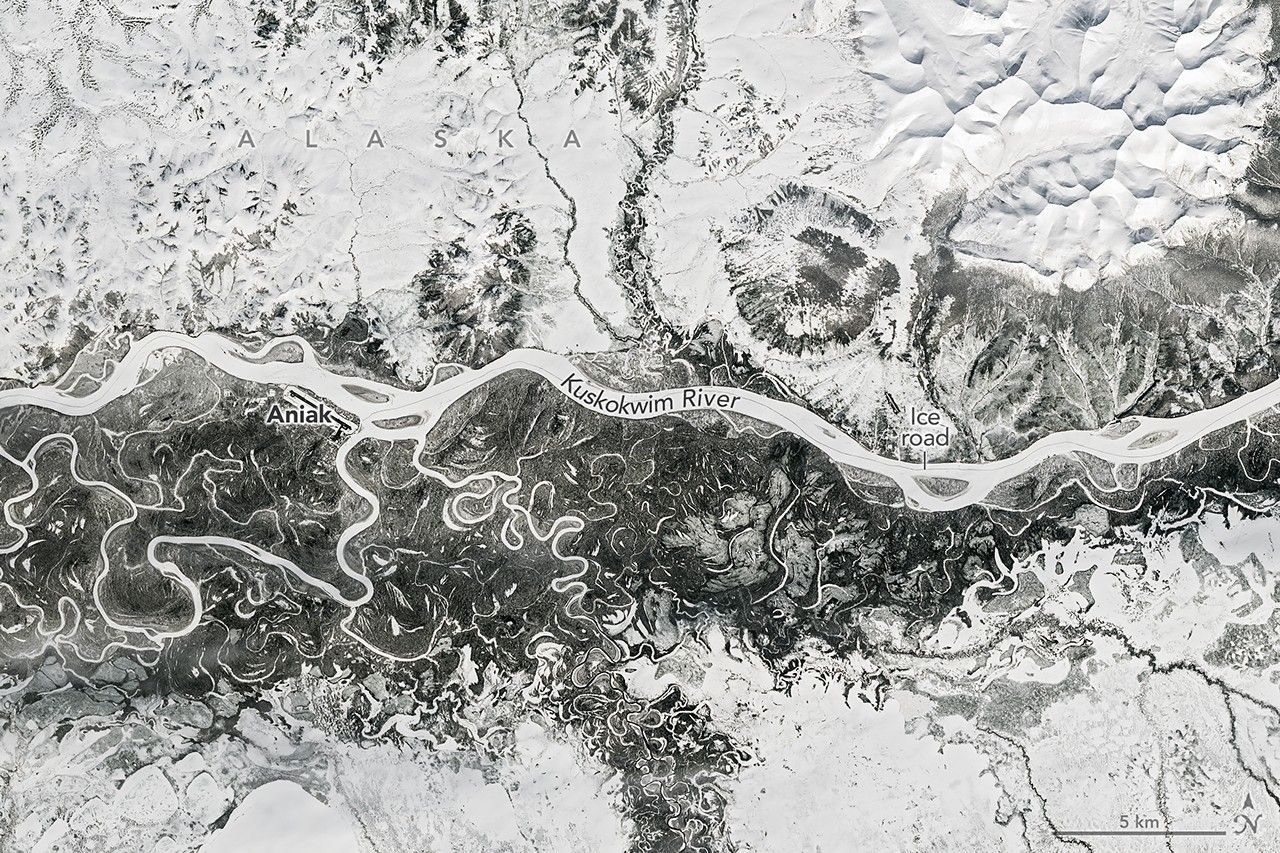

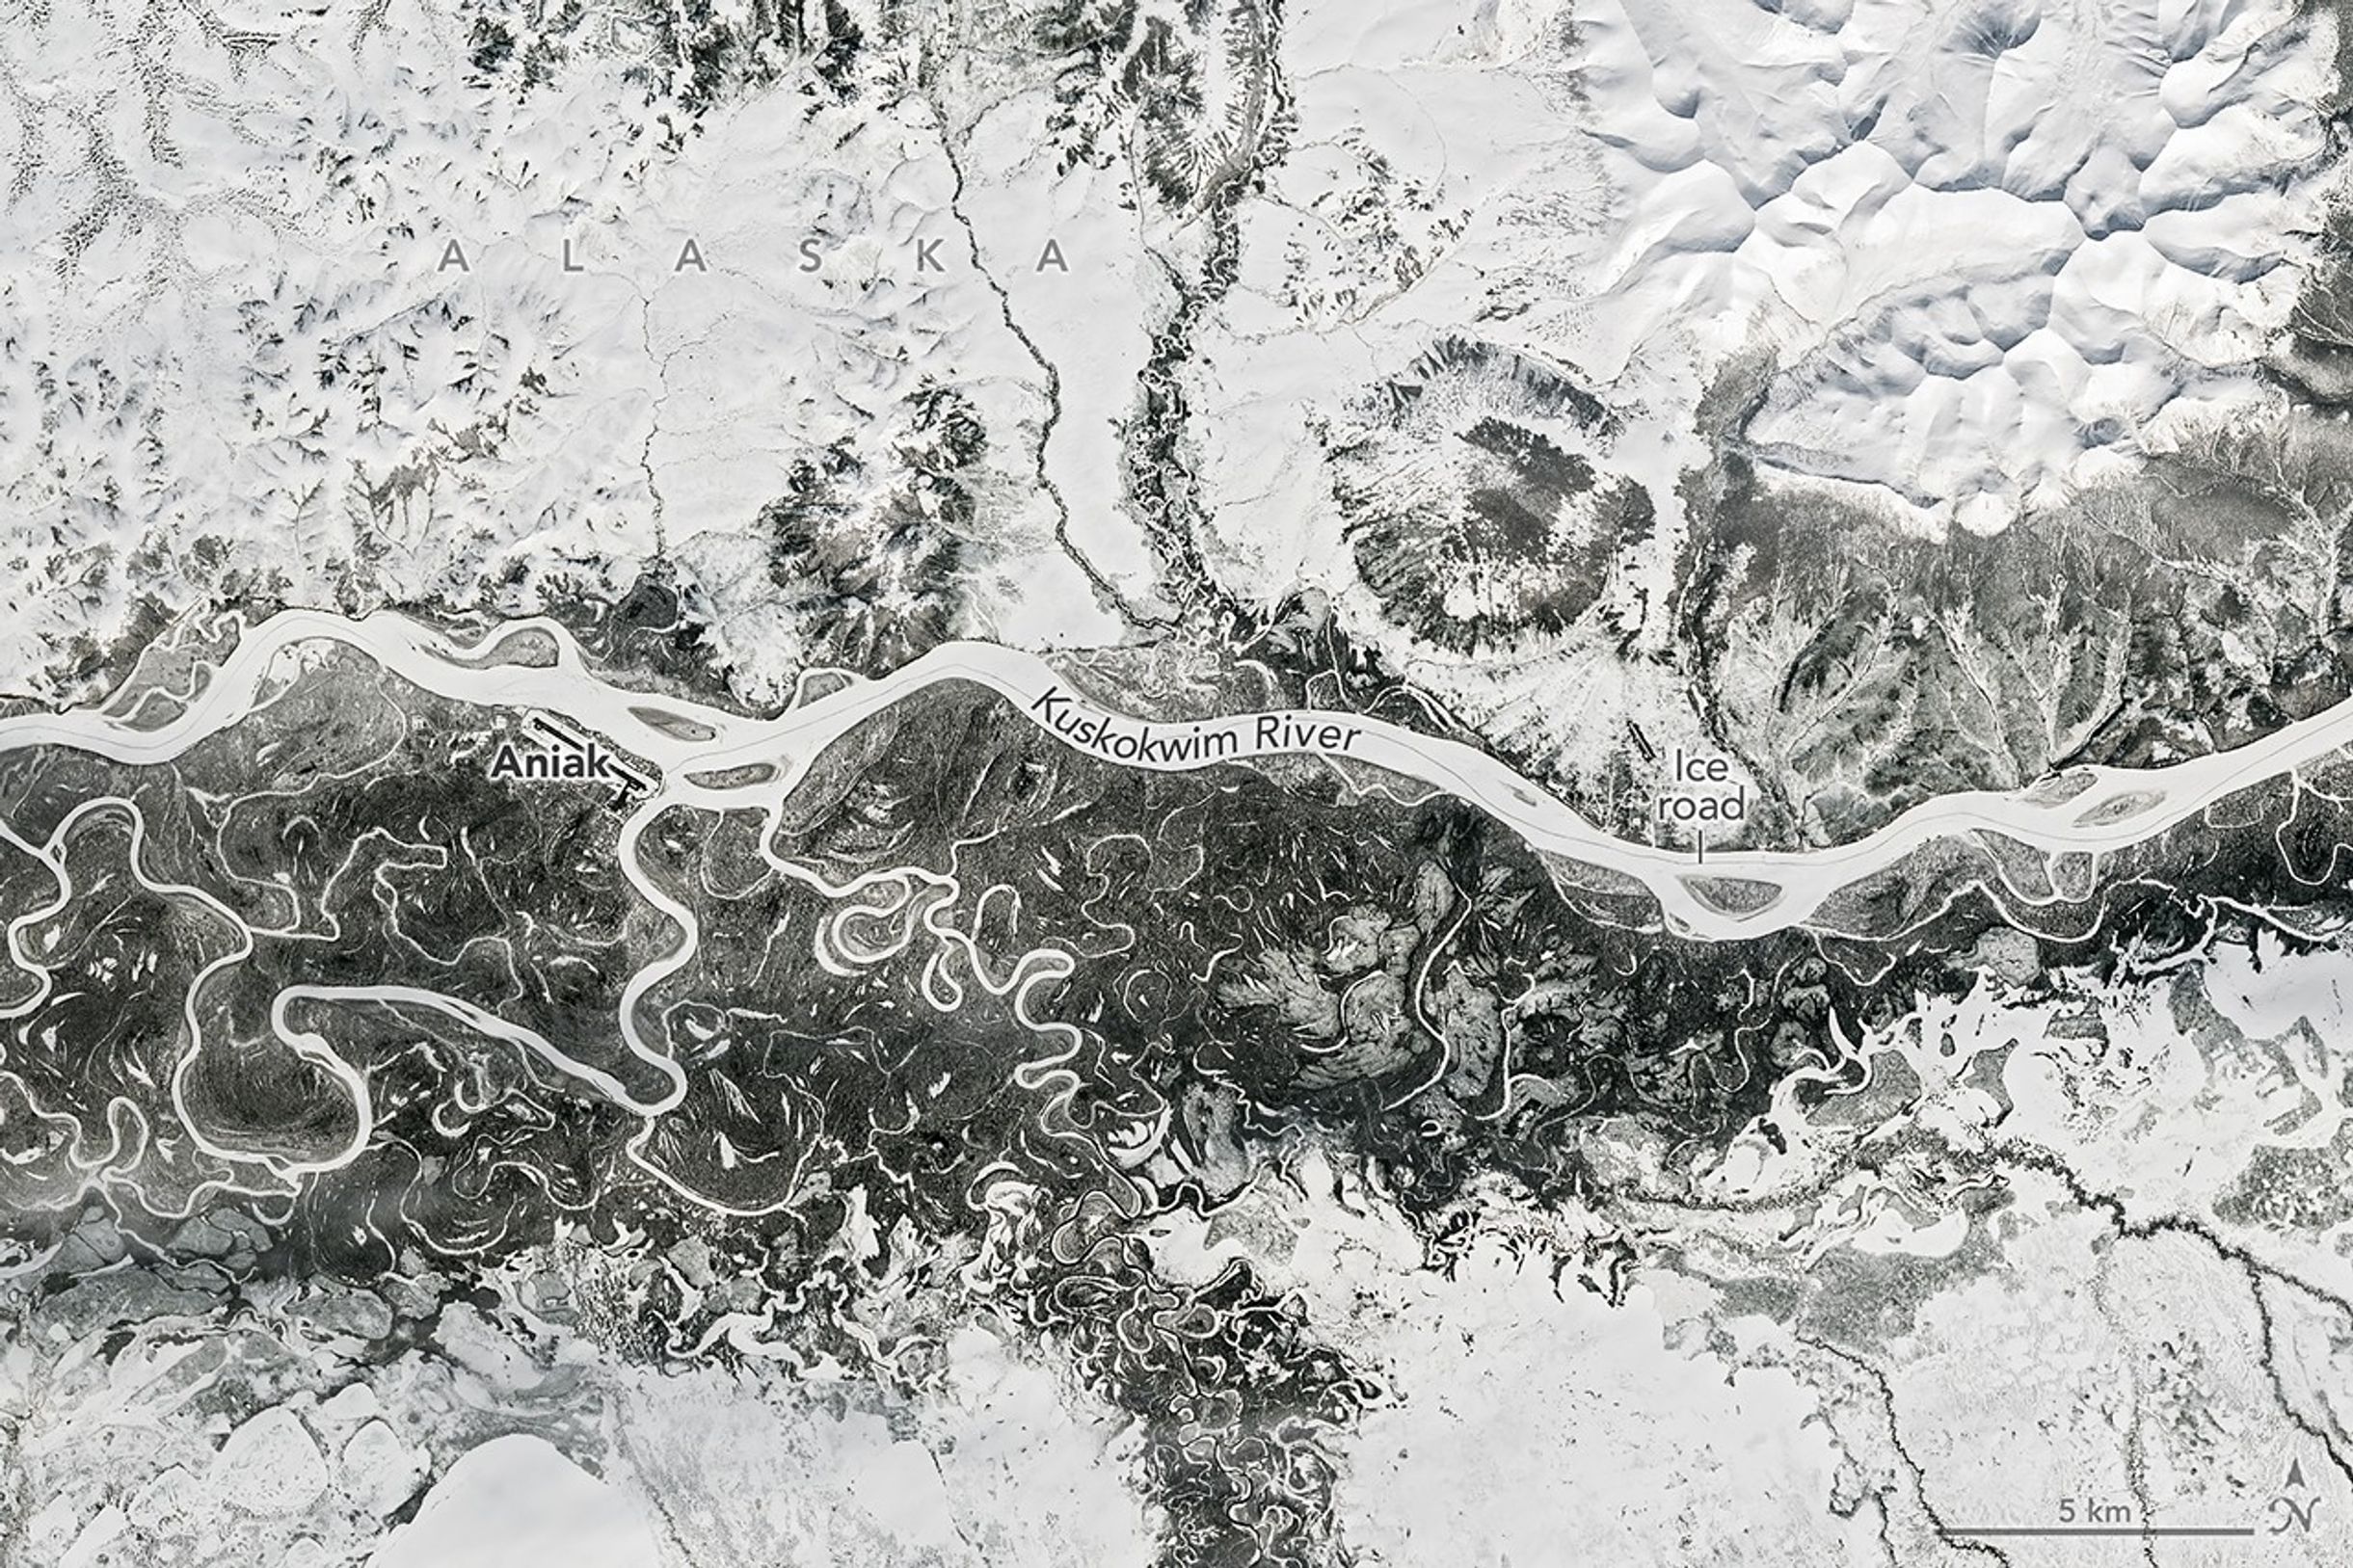
Thawing may be a welcome sight for Alaskans following a remarkably cold winter and early spring in much of the state. But with melting comes the threat of rapid flooding in low-lying areas as river ice breaks up and periodically jams.
The landscape along the Kuskokwim River appeared frozen in a Landsat 9 image acquired on April 21, 2026 (left). According to observations published by the Alaska-Pacific River Forecast Center, river ice near the town of Aniak was thick and still covered in deep snow as of April 16. The Kuskokwim ice road connecting numerous villages traces a dark line down the river. The thick river ice supported a route that extended about 350 miles (560 kilometers) in winter 2025-2026 and shut down for the season on April 10, according to news reports.
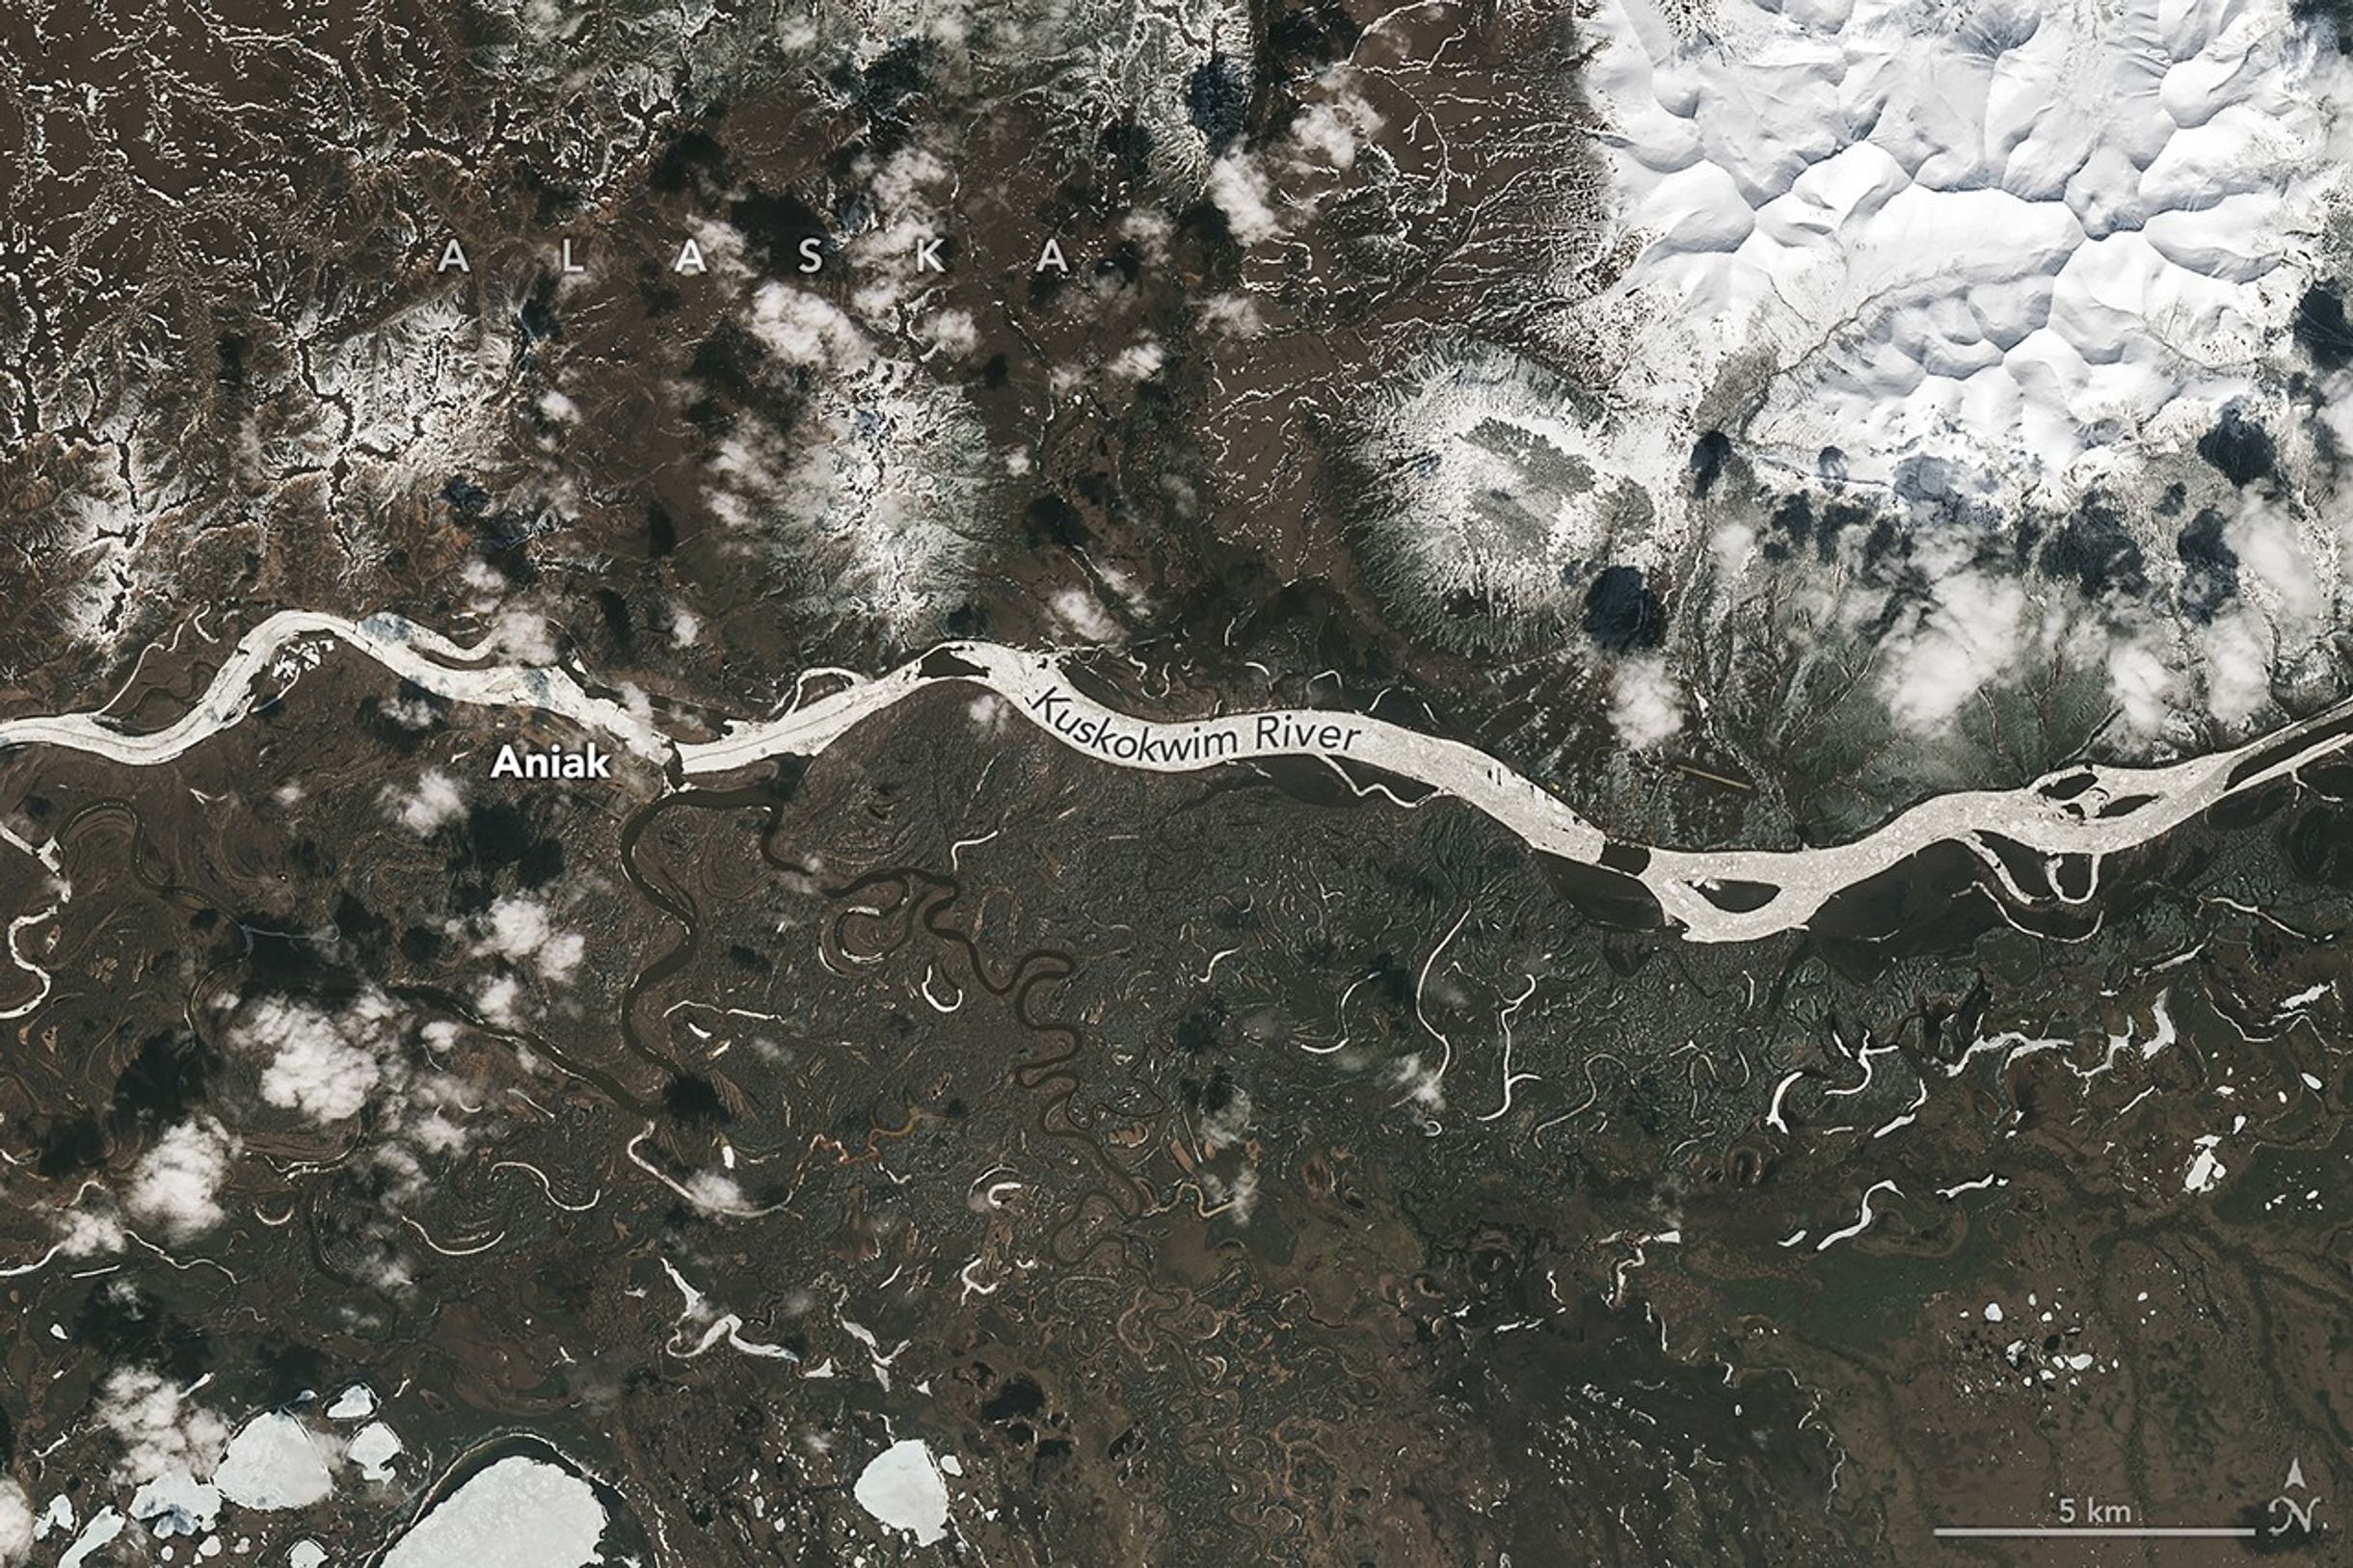
Conditions were changing quickly around May 7, when the right image was acquired. The previous day, the front of the ice breakup had nearly reached Aniak, and a sheet of grounded ice caused a jam that stretched 21 miles (34 kilometers) upstream. News reports showed ice chunks several feet thick piled up on riverbanks around the town. Ice became unstuck by May 7, and the backup, visible above (right), had started to flow downstream.
Aniak remained at risk, however, as ice clogged the river later that night, this time several miles downstream from the community. Waters began to rise, and a flood watch was issued for the town on May 8. Water inundated low-lying areas and encroached on homes and businesses near the east side of the runway, according to reports, before receding two days later.
Flooding caused by spring breakup can be most hazardous when heavy snowpack and thick ice remain in place from the winter and there’s a sudden transition from freezing to warmer temperatures. In what is known as a dynamic breakup, snowmelt encounters intact ice and causes water to back up quickly. On the other hand, if ice weakens before significant snowmelt or ice from upstream arrives, jams are less likely to form.
Forecasters noted that spring 2026 showed warning signs of a dynamic breakup. Snowpack was above average in some major river drainages, and historically low temperatures marked the winter and spring months in many places. For example, the March average temperature in Bethel, downstream of Aniak, was 14 degrees Fahrenheit (8 degrees Celsius) below normal. However, floods had been relatively minor along the large rivers through early May, experts noted, while cautioning that more severe flooding still has the potential to develop quickly.
NASA Earth Observatory images by Michala Garrison, using Landsat data from the U.S. Geological Survey. Story by Lindsey Doermann.
Stay up-to-date with the latest content from NASA as we explore the universe and discover more about our home planet.

Ice in the Hudson River hugged the shore of Manhattan amid a deep freeze.
Nearly 50 years ago, the first Landsat satellite captured the rare sight of Mid-Atlantic waterways frozen over.
Scientists relied on satellite data to understand how the Antarctic glacier lost so much ice so rapidly.
The post Ice Moves Out of Aniak appeared first on NASA Science.
| archive - contact - sexy exciting merchandise - search - about |

| ← previous | May 13th, 2026 | next |
May 13th, 2026: This comic was inspired by ideas! If you've ever had an idea you know how sometimes they show up without warning and are easily forgotten. In this way they are much like breakfasts, especially when breakfasts show up at unexpected times and aren't memorable. DID YOU KNOW: not all similes are good?? – Ryan | ||
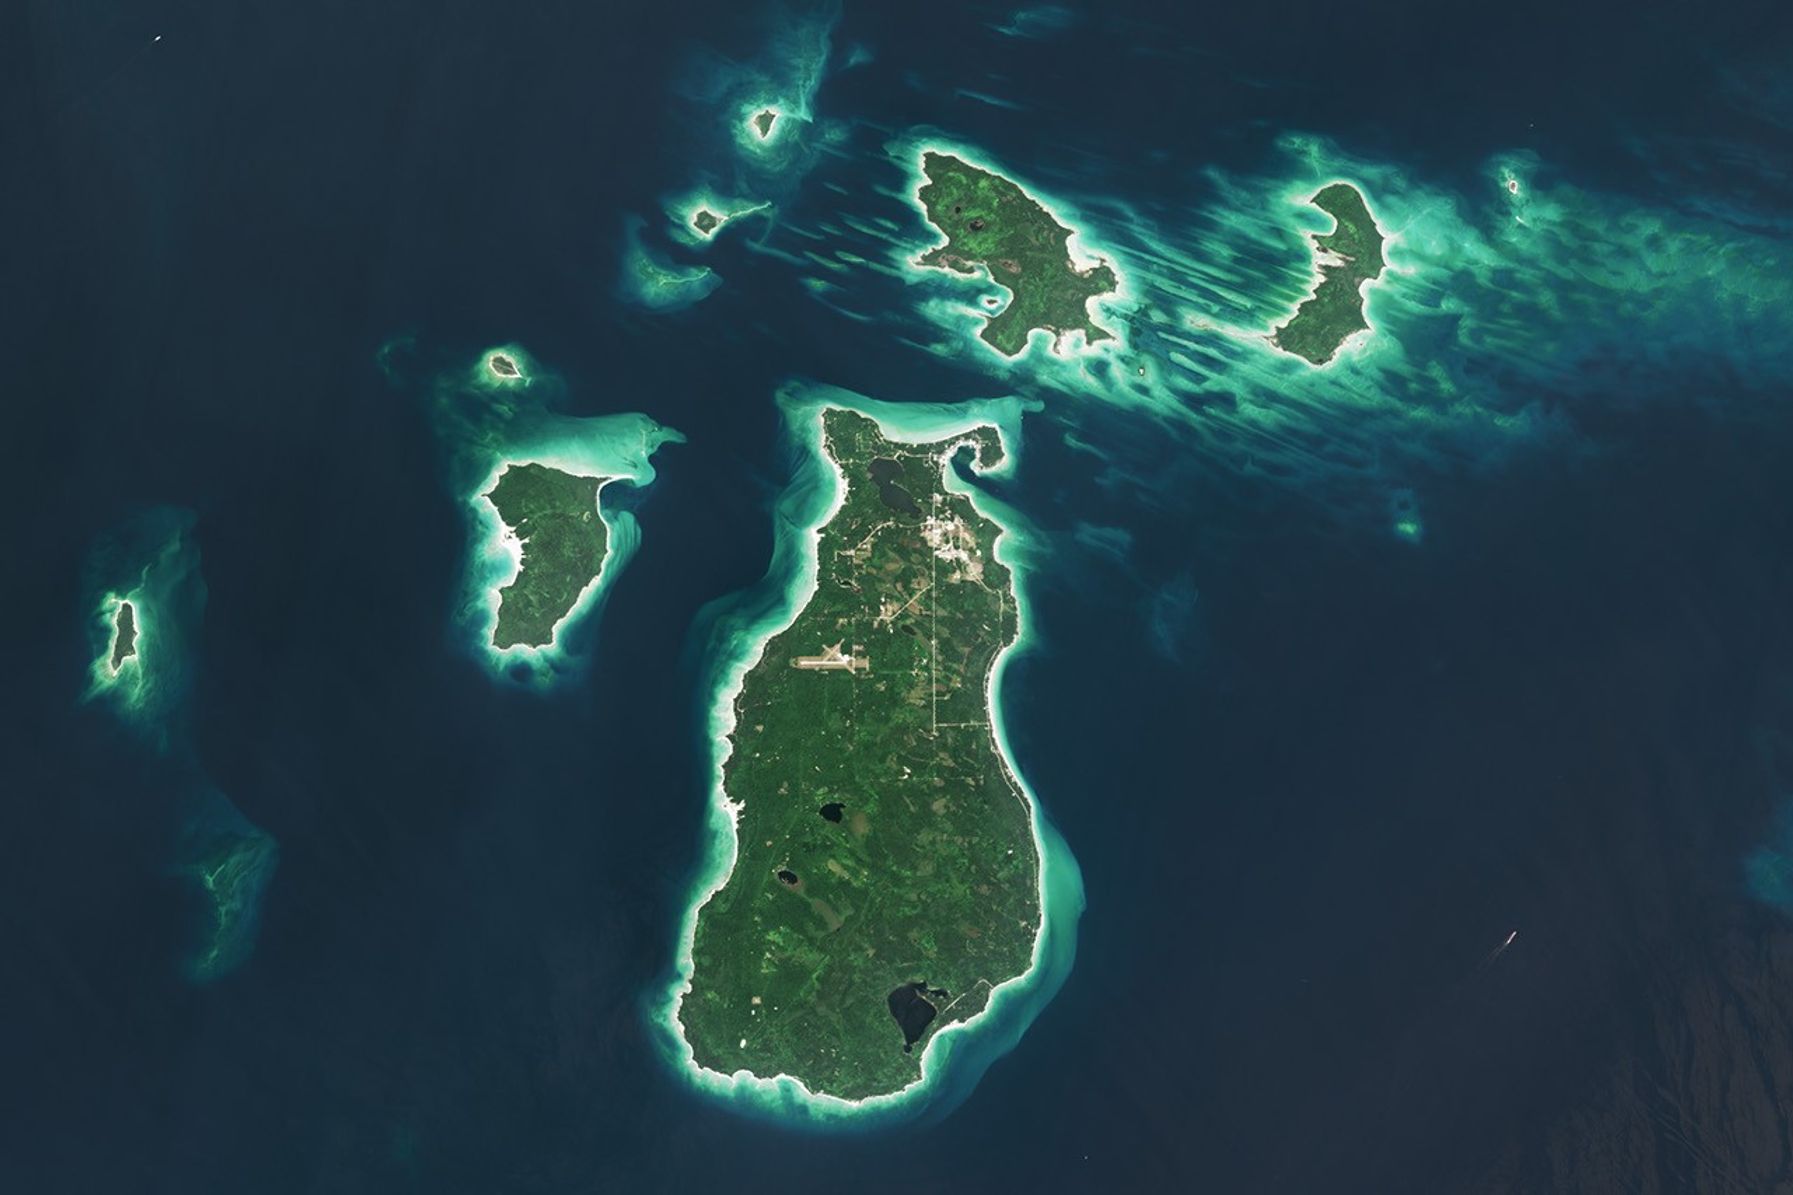
In a process that played out over thousands of years, a retreating ice sheet carved, scoured, and shaped the landscape of the present-day Great Lakes. In northern Lake Michigan, this sculpting left distinct ridges and valleys running north-to-south along the lake floor. Some parts of those ridges, made of erosion-resistant rock, have remained above the waves of the big lake, forming the Beaver Archipelago.
The OLI (Operational Land Imager) on Landsat 9 captured this image of several of the archipelago’s islands on August 2, 2024. These patches of land contain upland forests, dunes, wetlands, and marshes—habitats that support rare plant and bird species and provide spawning grounds for fish. The bright, sandy perimeters of the islands are surrounded by shallow, turquoise waters and deeper, dark blue areas, where depths reach up to about 330 feet (100 meters).
This image centers on Beaver Island, the largest island in Lake Michigan at 13 miles (21 kilometers) long and 6 miles (10 kilometers) wide. It is also the only inhabited island of the Beaver Archipelago, and many of its approximately 600 residents are of Irish descent. In the mid-1800s, scores of immigrants from County Donegal, Ireland, and Irish fishermen from nearby islands and ports in Michigan settled on the island, which subsequently took on the moniker of “America’s Emerald Isle.”
The farming and fishing, in particular, were productive for the new arrivals. In the 1880s, Beaver Island became the largest supplier of freshwater fish in the United States. Due to overfishing, however, such abundance would be short-lived.
Ship traffic on the Great Lakes was also increasing during this time. Two lighthouses were constructed on the island to help the growing number of vessels traveling between Chicago and the Straits of Mackinac. The Beaver Head Lighthouse operated from 1852 to 1962 on the southern end of the island. On the northern side, the Beaver Island Harbor Light, pictured below, was first lit in 1870 and remains an active beacon more than 150 years later.
Today, people travel to Beaver Island by boat or plane to explore its history and enjoy activities such as biking, fishing, and kayaking. The island’s remote location and minimal light pollution led to the establishment of the Beaver Island State Wildlife Research Area International Dark Sky Sanctuary in 2024. Sky gazers may be drawn to the sanctuary for a chance to glimpse the aurora borealis and other celestial phenomena.
Neighboring islands in the archipelago are more difficult to access and have remained relatively undisturbed. Perched, or cliff-top, sand dunes are found up to 200 feet (60 meters) above the lake level on the western side of High Island. Unique plant species, including the Pitcher’s thistle and Lake Huron tansy, grow in the island’s dunes. On Hog Island, patches of old-growth northern hardwood forest remain. Wetland communities known as Great Lakes marshes along the shoreline provide spawning grounds for perch and smallmouth bass.
NASA Earth Observatory image by Wanmei Liang, using Landsat data from the U.S. Geological Survey. Photo by Kelcie Herald/Unsplash. Story by Lindsey Doermann.
Stay up-to-date with the latest content from NASA as we explore the universe and discover more about our home planet.

Icy, isolated Peter I Island stirred up a show in the atmosphere off the West Antarctic coast.

The activity of herring around Vancouver Island in British Columbia brightened coastal waters enough to be detectable from space.

Winds blowing past the volcanic landmass near the Korean Peninsula created a trail of spiraling clouds, while murky water churned…
The post America’s Emerald Isle appeared first on NASA Science.
NASA’s Perseverance Mars rover used its Mastcam-Z camera to capture this panorama of an area nicknamed “Arbot” on April 5, 2026, the 1,882nd Martian day, or sol, of the mission, during the rover’s deepest push west beyond Jezero Crater. Made of 46 images, the panorama offers one of the richest geological vistas of the mission, revealing a windswept landscape of diverse rock textures. This is an enhanced-color version, which had its color bands processed to improve visual contrast and accentuate color differences.
Figure A is a natural-color version of the mosaic.

Figure B is a 3D anaglyph version designed for use with red-blue glasses. It is composed of 92 images collected by Mastcam-Z.
NASA’s Jet Propulsion Laboratory, which is managed for the agency by Caltech in Pasadena, California, built and manages operations of the Perseverance rover. Arizona State University leads the operations of the Mastcam-Z instrument, working in collaboration with Malin Space Science Systems in San Diego, on the design, fabrication, testing, and operation of the cameras, and in collaboration with the Niels Bohr Institute of the University of Copenhagen on the design, fabrication, and testing of the calibration targets.
For more about Perseverance: science.nasa.gov/mission/mars-2020-perseverance/
The post NASA’s Perseverance Captures Panorama at ‘Arbot’ appeared first on NASA Science.
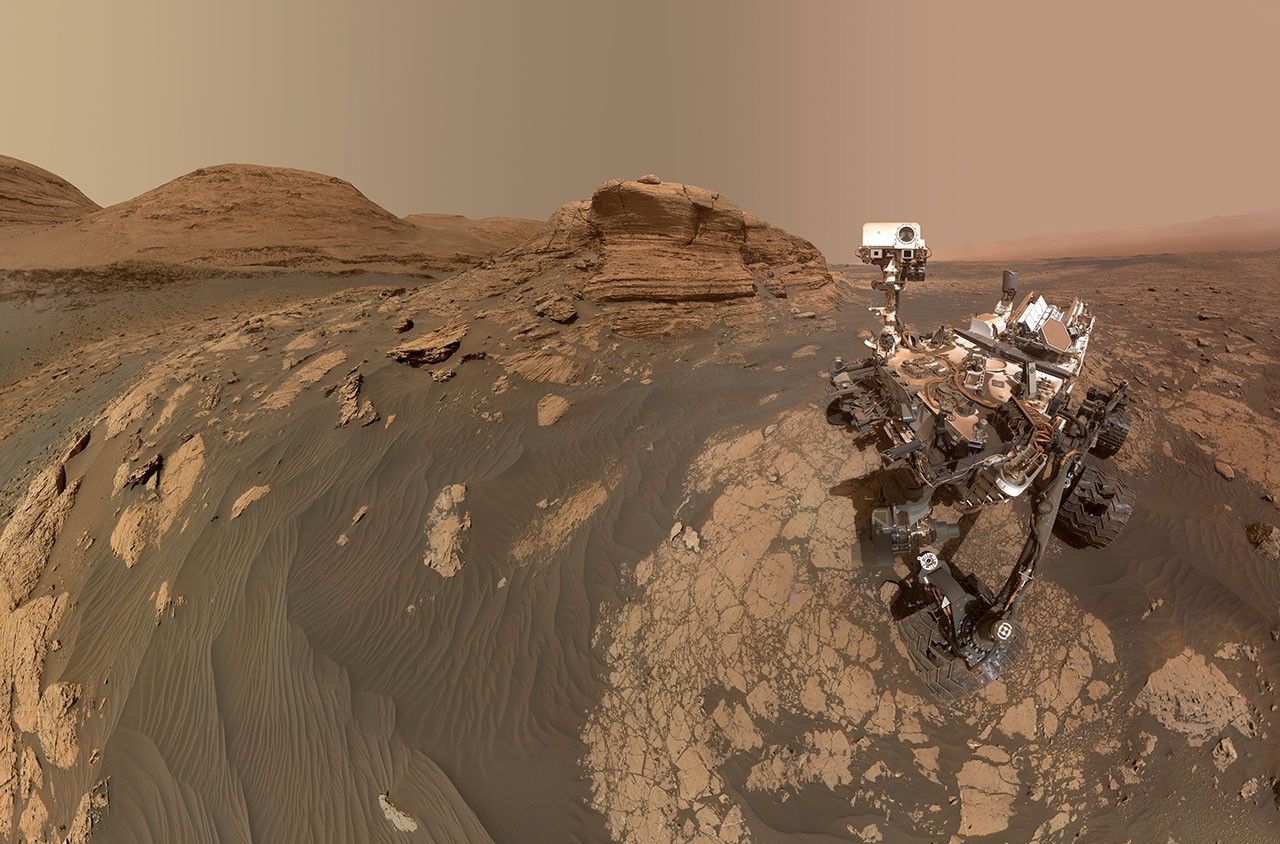
NASA’s Perseverance Mars rover took this selfie on March 11, 2026, the 1,797th Martian day, or sol, of the mission, during the rover’s deepest push west beyond Jezero Crater. Assembled from 61 individual images, the selfie shows Perseverance training its mast on the “Arathusa” rocky outcrop after creating a whitish circular abrasion patch. The crater’s western rim of Jezero Crater is visible in the background.

Figure A is a version of the selfie in which the rover appears to be looking at the camera.
Here is a GIF combining the main image and Figure A, in which the rover appears to look up and down.
The selfie is composed of images taken by the WATSON (Wide Angle Topographic Sensor for Operations and eNgineering) camera on the end of the rover’s robotic arm. The images were stitched together after being sent back to Earth.
WATSON is part of an instrument called SHERLOC (Scanning Habitable Environments with Raman & Luminescence for Organics & Chemicals). WATSON was built by Malin Space Science Systems (MSSS) in San Diego and is operated jointly by MSSS and JPL.
The rover’s process for taking a selfie is explained in this video.
NASA’s Jet Propulsion Laboratory, which is managed for the agency by Caltech in Pasadena, California, built and manages operations of the Perseverance rover.
For more about Perseverance:
https://science.nasa.gov/mission/mars-2020-perseverance/
The post NASA’s Perseverance Rover Snaps Westernmost Selfie appeared first on NASA Science.